Understanding SALT Measures: Standard Deviation
Understanding SALT Measures: Standard Deviation
Published at: 2018-10-10
So there is this odd thing that happens once in a while when you are using SALT: a measure comes back with a seemingly nonsensical standard deviation (SD) value. We’ve seen them come in as low as 21 SDs below the mean. And it’s not a mistake. Why does this happen? Is there anything valuable you can learn from this result? How can you report this result (for example on an IEP report) in a meaningful way? Ok, so a quick refresher on the concept of standard deviations. Standard deviation is roughly: the amount of difference you might expect to see between scores. *Not interested in the stats? You can skip this section if you want. We get back to speech and language stuff below. ___________________ The statistical formula used to calculate standard deviations looks like this: 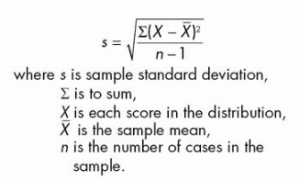
*Illustration from: Statistics in Plain English, 4th Ed.
You don’t really need to understand this formula for our purposes. The point is this: standard deviation is basically the average variation in your data. Imagine I’m measuring the height of patients in my women’s clinic. I might find that they range from 53 to 74 inches, with an average of 63.8 inches and a standard deviation of 3.5 inches. What does that mean? Well, the average woman will be 63.8 inches tall, but anywhere between 60.3 and 67.3 inches is pretty standard. And what does “pretty standard” mean in this context? That’s the joy of the standard deviation: by the magic of math, 68.3% of the observations in our normally-distributed data are always within 1 standard deviation above or below the mean. In turn, 2 standard deviations contain 95.4% of the observed data, and 3 standard deviations contain 99.7% of the observed data. In our height example, 1 standard deviation = 3.5 inches. So, 68.3% of the women in our data are between 60.3 and 67.3 inches. And the inverse also holds: if 68.3% of women are within 1 standard deviation, then 31.7% are further out (in the “tails” of the distribution), half (15.9%) above and half below the mean. 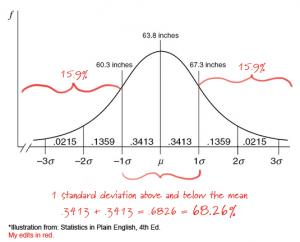 But we can also turn the standard deviation around and use it as a standardized unit of measure to describe individual data points. This is called the Z-score and it is defined as the number of standard deviations a given data observation lies away from the mean. On SALT reports you will see the Z-score labeled as “+/- SD.” So what if a woman walked into my clinic who was exactly 1 standard deviation above the mean? Well, she would be 67.3 inches tall, 15.9% of women in the clinic would be taller than her, and the rest of the women (84.1%) would be shorter. But what if I pulled a women’s file from my records at random? Without opening the file, how likely is it that this woman is taller than 67.3 inches? Well, it’s not a very good bet: only a 15.9% chance. Finally, imagine we find a misplaced file in the hallway, right between our clinic and the men’s basketball clinic nextdoor. We look at the file and see that the person’s height is 74.3 inches. Without knowing anything else about this individual, we can say that he or she is exactly 3 SDs above the norm for women in my clinic. So how likely is it that this file belongs to my clinic? Well, recall that 3 SDs contains 99.7% of the observed data and the remaining 0.3% is split between the upper and lower tails of the distribution. This means that one of my clients, chosen at random, would have only a 0.15% chance of being that tall, so maybe we better check next door first. And that is what standard deviation and the Z-score really have to tell us: the likelihood that a randomly-selected member of the population from which our sample is drawn would have a result at least as extreme as the one we are observing in this case.
| Standard Deviation (SD) | Percent of scores that are within this many SDs (above or below) the norm | Percent of scores that are NOT within this many SDs (above or below) the norm, i.e., percent of scores which are more than this many SDs either above or below norm. | Percent of scores which are more than this many SDs above the norm OR below the norm, but not both above and below. |
| 1 | 68.3% | 31.7% | 15.85% |
| 2 | 95.4% | 4.6% | 2.30% |
| 3 | 99.7% | 0.3% | 0.15% |
(A nifty calculator for calculating probability given the +/- standard deviation (aka: Z-score) can be found here: https://measuringu.com/pcalcz/) So, what do I want you to take away from this example? Three things:
- You need to know who the sample population is.
- Standard deviation depends on the variation in your sample population.
- Standard deviation measures the likelihood that a randomly-selected member of the sample population would have a result at least as extreme as the one we are observing in this case.
___________________ Now let’s bring it back to speech and language pathology. So, what’s happening when SALT returns ridiculously extreme +/- SD scores? To illustrate, I’ll use an example of one SALT measure where this happens most often: intelligibility. And the key to understanding why this happens is to look at 1) who the sample population is, and 2) how much variation there is in the results. First, the sample population. The students sampled in the SALT databases are typically developing, the samples were elicited by experienced SLPs in a quiet area using good recording equipment, and the samples were transcribed by professional SALT transcribers. These are near-perfect circumstances for getting high intelligibility scores. For example, in the SALT Narrative Story Retell database, an average of 98.9% of utterances from 10-year-olds have no unintelligible segments. Second, the variation. There is very little variation in the number of intelligible utterances found in the database samples; the results are clustered in a very small range. For 10-year-olds in the Narrative Story Retell database, scores range from 93.75% to 100% intelligible. This small variation results in a small standard deviation value. So even seemingly minor deviations from the mean can result in very high +/- SD scores. The real takeaway here is that you may have clients who have low intelligibility scores and thus have very high standard deviations from the SALT database norms. But is this a meaningful result? That really depends on what question you are asking. Remember, what SALT’s +/- SD for intelligibility really measures is: the likelihood that a typically-developing speaker under near-perfect sampling conditions would randomly produce the observed amount of intelligible utterances. In determining whether or not a client has a speech sound disorder, this can be a meaningful bit of information. If your client’s transcript was 21 standard deviations below the norm, for example, the answer is: it is very, very, very unlikely (the actual probability is beyond most calculators’ ability to display correctly) that a typically-developing speaker would have this result. But if the question you want to ask is: ‘how big a problem does this speaker have?’ then, no, the standard deviations do not really tell you very much at all. It is SO tempting to say that if your client’s result is that extreme, then their problem must be that extreme as well. But it just doesn’t work that way because the very high number of +/- SDs is just a result of the limited variability of this measure found in the database samples collected from typically-developing speakers. So what should you put in your report? Well, you can present this information as strong evidence of the existence of a speech sound disorder. But take care when including the +/- SD value. Remember, by definition approximately 99.7% of the sample data lies within 3 standard deviations from the mean. Reporting anything beyond +/- 3 SDs may improve accuracy, but it does not add much meaning to your report and may confuse your audience (unless, of course, they too read this blog). This is why the text-based Performance Report, introduced with SALT 18, now reports +/- SD scores greater than 3 as “more than 3 SDs” rather than using the calculated SD values. That way, the result is highlighted as significant, but doesn't look ridiculously extreme. ___________________ Resources Urdan, T. C. 2017. Statistics in Plain English, 4th Edition. (New York, NY: Routledge).
If you compare the test results of a child with a low average IQ score of 84 to the database of children who are typically developing, wouldn't you have to change the SD to 1.5 based on that child's IQ score as it falls between 76-89?
Changing the SD interval for reference database comparison outcomes is an option in SALT. Changing the SD interval doesn't change the value of the SD. It simply affects which measures will be highlighted in the reports. The SD is the average variation in the data. If you run at 1.5 SD from the mean, and you feel that is a fair(er) comparison, you could do this. But the important thing to note is that the SALT reference databases' sample population consists of typically developing speakers. The comparison of TD to ID, particularly when it comes to language outcomes, is challenging. It requires the use of clinical skills and knowledge of language development to interpret results. The most valid analysis results are best found using SALT's analyze menu where you will see only raw values (no comparison data). These outcomes are very useful, and, in particular, they are helpful in looking at change over time; e.g. sample one compared to sample two (same context) post treatment.